Hack-A-Sat CTF
2020-06-12
A majority of my Memorial Day weekend was spent working on the Hack-A-Sat CTF with a couple friends. Most of the challenges stumped us, yet we finished in the top 10% of teams after these solves.
Seeing Stars
Here is the output from a CCD Camera from a star tracker, identify as many stars as you can! (in image reference coordinates) Note: The camera prints pixels in the following order (x,y): (0,0), (1,0), (2,0)… (0,1), (1,1), (2,1)… Note that top left corner is (0,0)
Connecting to the challenge via netcat and providing our team’s ticket yielded lines of comma-separated numbers (the snippet below only shows the first three rows), followed by a prompt to enter our answers as coordinates. My initial reaction was to copy-paste all the numbers into a text editor, where I learned we had our hands on a 128 lines x 128 numbers grid. My next idea was to zoom out all the way in the text editor and squint my eyes in an attempt to discern a pattern or ASCII art, but I only saw clusters of numbers that had more than one digit. We then tried typing random input coordinates into the challenge, but the connection timed out faster than we could manually enter all our values, indicating that we needed to programmatically connect to the challenge.
2,5,9,4,2,8,2,8,2,0,1,1,6,8,9,6,0,3,7,0,9,9,4,2,8,4,9,2,1,8,4,8,3,8,1,9,1,8,1,6,3,1,9,5,5,3,2,0,1,6,1,8,9,8,7,3,8,0,4,3,7,4,8,7,2,2,1,9,5,1,6,9,6,2,4,3,7,0,8,5,9,2,6,3,2,9,3,4,6,8,3,6,6,6,4,8,5,6,7,5,6,3,3,2,1,1,7,1,0,9,2,1,0,8,1,2,7,2,7,7,3,0,0,2,4,7,0,3
6,1,5,0,3,2,4,9,3,9,2,7,4,3,4,0,5,3,5,6,0,1,0,0,5,1,2,9,8,2,8,9,0,5,2,6,2,6,9,3,8,0,8,0,8,0,4,2,9,7,0,7,1,4,1,7,6,3,7,2,4,8,6,1,1,4,1,6,3,3,1,0,3,4,9,7,6,6,4,7,4,0,6,5,2,6,2,8,8,6,2,8,7,0,8,0,7,7,4,2,9,8,0,2,4,9,2,8,9,0,7,8,3,2,2,9,6,7,9,6,1,2,9,7,4,9,8,9
0,8,5,3,8,4,3,9,4,4,0,5,2,4,4,0,3,8,0,0,1,7,9,7,3,6,1,2,9,3,3,1,0,5,9,3,9,7,3,8,2,3,0,0,9,0,3,7,7,1,3,4,8,0,2,3,3,7,2,5,9,4,0,5,0,6,0,6,9,3,4,6,7,2,9,6,9,6,4,5,6,8,6,5,5,1,0,4,2,3,4,6,6,7,1,6,8,8,7,3,8,9,4,8,1,4,7,9,6,6,3,1,3,1,1,4,4,1,2,3,5,0,6,3,3,2,3,5
...
Enter your answers, one 'x,y' pair per line.
(Finish your list of answers with an empty line)
Timeout, Bye
We found a nclib package for Python that provides netcat functionality and threw together a script to collect the grid values. The range of numbers in the grid was [0, 255], which we realized is the same range used for RGB color values. We plotted the grid as a matrix of monochrome values and saw stars! 🤩
import nclib
import numpy as np

nc = nclib.Netcat(("stars.satellitesabove.me", 5013))
nc.recv()
ticket = b"ticket{<REDACTED>}"
nc.send_line(ticket)

def receive_grid():
    binaries = [nc.recv_until(b"\n") for _ in range(128)]
    decoded = [[int(i) for i in b.decode("utf-8").strip("\n").split(",")] for b in binaries]
    grid = np.array(decoded) # (row, col) ~ (x, y)
    return grid

gridArray = receive_grid()
print(gridArray.shape, np.amin(gridArray), np.amax(gridArray)) # (128, 128) 0 255
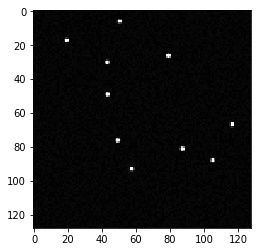
The stars were visually identifiable as white pixels (255 values in the grid), meaning we were to submit the (x, y) coordinates of the white pixel clusters. This seemed pretty simple, so we found the (row, col) coordinates of each 255-valued pixel and submitted them, only to get Too many Guesses Failed...
After some discussion, we decided to get the first pixel coordinate of each cluster and ignore any remaining white pixels that were within 3 index positions from the selected coordinate.
def get_coordinates(array):
    solutions = []
    for row in range(len(array)):
        for col in range(len(array[row])):
            if array[row][col] == 255:
                skip = False
                for r, c in solutions:
                    if abs(r - row) < 3 and abs(c - col) < 3:
                        skip = True
                if skip:
                    continue
                solutions.append((row, col))
    sol = "\n".join([f"{x},{y}" for x, y in solutions])
    return bytearray(sol+"\n", "utf-8")

nc.send_line(get_coordinates(gridArray))
# bytearray(b'6,50\n17,19\n26,79\n30,43\n49,43\n66,116\n76,49\n81,87\n87,105\n92,57\n')
Instead of the anticipated flag, the challenge sent back b'4 Left...\n' and another grid of 128x128 numbers, implying we had four more of these grids left to solve. Setting up a loop to retrieve coordinates for all five grids yielded the flag!
nc = nclib.Netcat(("stars.satellitesabove.me", 5013))
nc.recv()
ticket = b"ticket{<REDACTED>}"
nc.send_line(ticket)

for _ in range(5):
    gridArray = receive_grid()
    nc.recv() # Prompt to enter answers
    nc.send_line(get_coordinates(gridArray))
    nc.recv_until(b"\n") # Number of grids left
print(nc.recv()) # Obtain flag

>>> b'flag{<REDACTED>}\n'
Where’s the Sat?
Let’s start with an easy one, I tell you where I’m looking at a satellite, you tell me where to look for it later.
You’ll need these files to solve the challenge.
stations.zip
Unzipping the stations.zip file gave us a stations.txt, which held information about 72 objects (satellites, we thought):
ISS (ZARYA)
1 25544U 98067A   20101.49789620 -.00000843  00000-0 -72437-5 0  9994
2 25544  51.6442 323.4418 0003567  97.5001 333.2274 15.48679651221520
NSIGHT
1 42726U 98067MF  20101.41972867  .00345433  66479-4  45399-3 0  9990
2 42726  51.6243 209.0044 0009087 327.3341  32.7108 16.06219602164768
KESTREL EYE IIM (KE2M)
1 42982U 98067NE  20101.36603301  .00013519  00000-0  12255-3 0  9998
2 42982  51.6346 268.5674 0003561 191.4761 168.6155 15.68377454140382
ASTERIA
1 43020U 98067NH  20100.83214555  .00396983  83692-4  55667-3 0  9997
2 43020  51.6446 225.1325 0006274 348.4396  11.6471 16.05206331136684
...
After connecting to the challenge and authenticating our ticket, we got:
Please use the following time to find the correct satellite:(2020, 3, 18, 10, 19, 0.0)
Please use the following Earth Centered Inertial reference frame coordinates to find the satellite:[3115.215886589452, 5158.712355166438, 3004.7264920789257]
Current attempt:1
What is the X coordinate at the time of:(2020, 3, 18, 7, 20, 44.0)?
The prompt provided a specific datetime and coordinate set that was presumably related to one of the satellites in the text file. The given timestamp and coordinates remained the same each time we connected to the challenge. We concluded that the goal was to identify which of the satellites the prompt was referring to, then figure out its location at following timestamps.
I started off by googling the words appearing every three lines in the text file and learned that they were real satellite names. I also noticed that the second values of each satellite’s data rows were nearly identical, with the first row’s value having an extra “U” tacked on. Searching for integers and float values usually doesn’t yield meaningful results, so I opted to google the alphanumeric values occurring in the first data row for every satellite. Searching for 98067A led me to a NASA ISS Trajectory Data page, where the alphanumeric value was listed under “TWO LINE MEAN ELEMENT SET.” A search for that brought me to the Two-line element set Wikipedia page, where I learned that TLEs encode data about a satellite’s orbit and can be used to predict the satellite’s position and velocity at another point in time. This seemed precisely what I was looking for and after more research, I found this article by Brandon Rhodes, which demonstrates how to use his skyfield library to determine a satellite’s position at a given epoch.
Before connecting to the challenge again, I used this information to identify the satellite in question.
import numpy as np
import pandas as pd
from skyfield.api import EarthSatellite, load

# columns = [0, 1, 2] ~ [satellite name, line1, line2]
df = pd.DataFrame(pd.read_csv("stations.txt", header=None).values.reshape(-1, 3))

ts = load.timescale()
givenTime = ts.utc(2020, 3, 18, 10, 19, 0.0)
givenCoords = np.array([3115.215886589452, 5158.712355166438, 3004.7264920789257])
satellite = None

for index, row in df.iterrows():
    satellite = EarthSatellite(row[1], row[2], row[0], ts)
    coords = np.array(satellite.at(givenTime).position.km)
    diff = np.sum(np.abs(coords - givenCoords))
    if np.round(diff) == 0:
        print("Satellite found:", satellite)
        break

>>> Satellite found: EarthSatellite 'RAINCUBE' number=43548 epoch=2020-04-10T01:56:44Z
The connection timeout for this challenge was far more generous than the first one’s, so I opted to enter coordinates manually instead of spending extra time setting up another nclib connection. After copy-pasting coordinates between windows for three rounds of timestamps, I obtained the flag.
def get_position(queryTime):
    t = ts.utc(*queryTime)
    return satellite.at(t).position.km

get_position((2020, 3, 18, 8, 18, 23.0))
>>> array([ 3474.36216093, -2545.6708836 , -5192.25523078])

get_position((2020, 3, 18, 15, 8, 39.0))
>>> array([-2570.02591823,  3292.1839807 ,  5274.93570105])

get_position((2020, 3, 18, 6, 23, 34.0))
>>> array([-4872.15481905, -4556.0650086 ,  -967.38847043])
$ nc where.satellitesabove.me 5021
Ticket please:
> ticket{<REDACTED>}
Please use the following time to find the correct satellite:(2020, 3, 18, 10, 19, 0.0)
Please use the following Earth Centered Inertial reference frame coordinates to find the satellite:[3115.215886589452, 5158.712355166438, 3004.7264920789257]
Current attempt:1
What is the X coordinate at the time of:(2020, 3, 18, 8, 18, 23.0)?
> 3474.36216093
What is the Y coordinate at the time of:(2020, 3, 18, 8, 18, 23.0)?
> -2545.6708836
The Y coordinate for (2020, 3, 18, 8, 18, 23.0) is correct!
What is the Z coordinate at the time of:(2020, 3, 18, 8, 18, 23.0)?
> -5192.25523078
The Z axis coordinate for (2020, 3, 18, 8, 18, 23.0) is correct!
Current attempt:2
What is the X coordinate at the time of:(2020, 3, 18, 15, 8, 39.0)?
> -2570.02591823
What is the Y coordinate at the time of:(2020, 3, 18, 15, 8, 39.0)?
> 3292.1839807
The Y coordinate for (2020, 3, 18, 15, 8, 39.0) is correct!
What is the Z coordinate at the time of:(2020, 3, 18, 15, 8, 39.0)?
> 5274.93570105
The Z axis coordinate for (2020, 3, 18, 15, 8, 39.0) is correct!
Current attempt:3
What is the X coordinate at the time of:(2020, 3, 18, 6, 23, 34.0)?
> -4872.15481905
What is the Y coordinate at the time of:(2020, 3, 18, 6, 23, 34.0)?
> -4556.0650086
The Y coordinate for (2020, 3, 18, 6, 23, 34.0) is correct!
What is the Z coordinate at the time of:(2020, 3, 18, 6, 23, 34.0)?
> -967.38847043
The Z axis coordinate for (2020, 3, 18, 6, 23, 34.0) is correct!
flag{<REDACTED>}
SpaceDB
The last over-the-space update seems to have broken the housekeeping on our satellite. Our satellite’s battery is low and is running out of battery fast. We have a short flyover window to transmit a patch or it’ll be lost forever. The battery level is critical enough that even the task scheduling server has shutdown. Thankfully can be fixed without without any exploit knowledge by using the built in APIs provied by kubOS. Hopefully we can save this one!
Note: When you’re done planning, go to low power mode to wait for the next transmission window
Initial connection to the challenge showed a virtual console log, with the critical-tel-check and update_tel sections repeating about every minute:
### Welcome to kubOS ###
Initializing System ...

** Welcome to spaceDB **
-------------------------

req_flag_base  warn: System is critical. Flag not printed.

critical-tel-check  info: Detected new telemetry values.
critical-tel-check  info: Checking recently inserted telemetry values.
critical-tel-check  info: Checking gps subsystem
critical-tel-check  info: gps subsystem: OK
critical-tel-check  info: reaction_wheel telemetry check.
critical-tel-check  info: reaction_wheel subsystem: OK.
critical-tel-check  info: eps telemetry check.
critical-tel-check  warn: VIDIODE battery voltage too low.
critical-tel-check  warn: Solar panel voltage low
critical-tel-check  warn: System CRITICAL.
critical-tel-check  info: Position: GROUNDPOINT
critical-tel-check  warn: Debug telemetry database running at: 3.19.61.44:29689/tel/graphiql

update_tel  info: Updating reaction_wheel telemetry.
update_tel  info: Updating gps telemetry.
update_tel  info: Updating eps telemetry.
A few things came to mind when I saw this:
warn: System is critical. Flag not printed.This was the flag I wanted and I probably needed to find a way to print it to the console. I figured I could get it to print when the system wasn’t “critical.”warn: VIDIODE battery voltage too low.The challenge prompt mentioned the satellite’s battery was low; this was presumably it. I thought I could get away with the low battery because in Python logging,warnlogs are typically used for noncritical messages, unlikeerrorlogs.warn: Solar panel voltage lowI wasn’t sure what solar panel voltage meant, but I assumed it had something to do with charging the battery through solar energy. I brushed off this warning for the same reason as the previous line.warn: System CRITICAL.“CRITICAL” status warranted awarnlog, so I was wrong about neglecting thewarnlines and did need to worry about the battery and solar panel.warn: Debug telemetry database running at: 3.19.61.44:29689/tel/graphiqlI tried commands likelsandpwdin the shell but the console wasn’t having any of it. This told me all interaction would happen at this URL.
Opening the link in a web browser took me to a GraphiQL interface. I’d vaguely heard of GraphQL before but didn’t know its syntax nor its capabilities. Going off the prefilled information, I started a GraphQL query with only {} and autocompleted (ctrl+space) as many options as the interface would give me to explore the responses each query would return. Sometimes the program generously autofilled missing parameters for me. Roughly five minutes in, the challenge connection timed out and I had to reconnect. The GraphiQL URL and telemetry data values were different and seemed to be dynamically created upon connection.
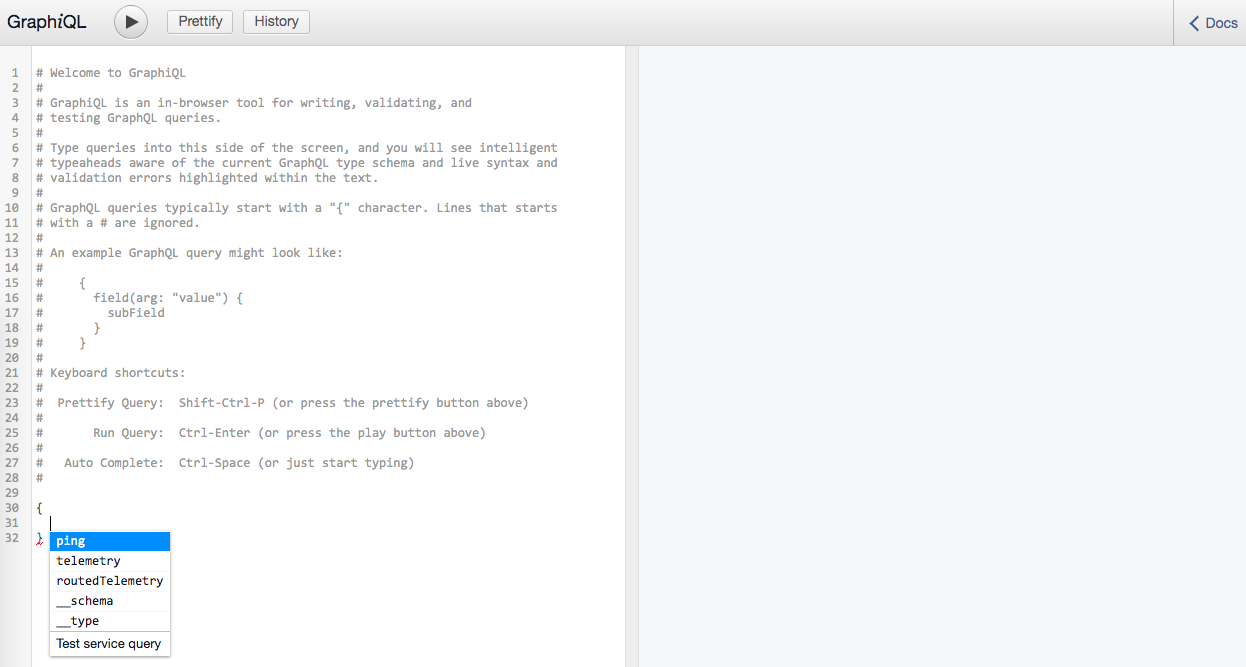
The routedTelemetry query didn’t work and the meta queries weren’t particularly useful, but the telemetry query returned valuable information:
# Query
{
  telemetry {
    timestamp
    subsystem
    parameter
    value
  }
}

# Response
{
  "data": {
    "telemetry": [
      {
        "timestamp": 1591772232.974785,
        "subsystem": "reaction_wheel",
        "parameter": "MOMENTUM_NMS",
        "value": "0.0"
      },
      {
        "timestamp": 1591772232.974785,
        "subsystem": "gps",
        "parameter": "VEL_Z",
        "value": "-1917"
      },
      ...,
    ]
  }
}
There were over 800k lines in the response so I copied it into a file and turned to pandas for analysis. The data seemed to describe sensor readings and system measurements of the satellite, which were frequently updated (likely during the update_tel part of the console logs). The battery voltage values seemed consistent with each other and I didn’t find any measurements of the solar panel’s voltage. I did find the VIDIODE parameter and confirmed that its value was indeed dropping over time as mentioned in the console warn logs.
import pandas as pd
import numpy as np

df = pd.read_json("data.json", orient="split")["telemetry"].apply(pd.Series)
df["value"] = df["value"].map(np.float)
print(df.head())

#       parameter       subsystem     timestamp   value
# 0  MOMENTUM_NMS  reaction_wheel  1.591772e+09     0.0
# 1         VEL_Z             gps  1.591772e+09 -1917.0
# 2         VEL_Y             gps  1.591772e+09 -4653.0
# 3         VEL_X             gps  1.591772e+09  5294.0
# 4     GPS_WEEKS             gps  1.591772e+09    61.0

print(df.groupby("subsystem").nunique())

#                 parameter  subsystem  timestamp  value
# subsystem
# eps                   114          1        118   7639
# gps                     9          1        117    785
# reaction_wheel          1          1        118    107

def printCounts(param):
    return df[df["parameter"].str.contains(param)]["parameter"].value_counts()

battery = printCounts("BATTERY")
voltage = printCounts("VOLTAGE")
print(battery[battery.index & voltage.index])

# BATTERY_1_OUTPUT_VOLTAGE     118
# BATTERY_0_PCM_3V3_VOLTAGE    118
# BATTERY_0_OUTPUT_VOLTAGE     118
# BATTERY_1_PCM_3V3_VOLTAGE    118
# BATTERY_1_PCM_5V_VOLTAGE     118
# BATTERY_0_PCM_5V_VOLTAGE     118
# Name: parameter, dtype: int64

print(printCounts("SOLAR"))

# Series([], Name: parameter, dtype: int64)

print(printCounts("VIDIODE"))

# VIDIODE    118
# Name: parameter, dtype: int64

print(df[df["parameter"] == "VIDIODE"].sort_values("timestamp", ascending=False).head())

#     parameter subsystem     timestamp     value
# 10    VIDIODE       eps  1.591772e+09  6.492488
# 134   VIDIODE       eps  1.591772e+09  6.485034
# 258   VIDIODE       eps  1.591772e+09  6.477303
# 382   VIDIODE       eps  1.591772e+09  6.473900
# 497   VIDIODE       eps  1.591772e+09  6.470000
At this point, I was under the impression that there was an unusual parameter responsible for the low VIDIODE values, and that I needed to tweak it to improve the system’s state. After scouring the query autocomplete options for parameters that could influence VIDIODE, I decided to look into what VIDIODE represented. I recognized “diode” as a word that’s often associated with circuits and recalled Ohm’s Law (V=IR) from my introductory circuits class, so I suspected that the “VI” in VIDIODE represented some relationship between voltage (V) and current (I). My friends were busy tackling another challenge at the time, so after a brainstorm about SpaceDB with them, I looked for a relationship between the BATTERY_*_VOLTAGE and VIDIODE values by computing vector correlations, but to no avail. Later, I wound up searching for the definition of a diode and found a section on its Wikipedia page describing diode behavior with I-V curves—a term I recognized from my intro circuits class! Although my VI/I-V hunch was correct, I didn’t understand the technical explanation well enough to know which parameters played a role in changing the VIDIODE value and felt like I was back at square one.
Feeling frustrated, I took a break to eat and talk with my dad about my dilemma around diodes and VIDIODE. He explained he was aware of two use cases for diodes: as an object for one-way currents in elementary circuits, and as a switch that changes values when it reaches a certain voltage threshold. A light bulb lit up in my head when he mentioned the switch! The console said the system was in a critical state because the VIDIODE voltage value was below a certain threshold; if I could change that VIDIODE value to a fake value above the threshold, maybe the system would be tricked into thinking its state was noncritical and print out the flag. For the past few hours I had limited my scope to read-only operations in GraphQL and completely neglected writing to the database.
After thanking my dad, I hurried back to my machine and googled ways to insert values in GraphQL. This cheatsheet suggested using a Mutation query to add and delete values from the database. I deleted everything in the input area and found a mutation query in the autocomplete!

The mutation query had several functions but I only cared about insert. Adding the insert and braces displayed some errors explaining I was missing the required success and error variables, so I filled those in and hit ctrl+enter. Clearly I still had errors, so I clicked the red underline of insert, which displayed a tooltip and opened a documentation panel on the right side!

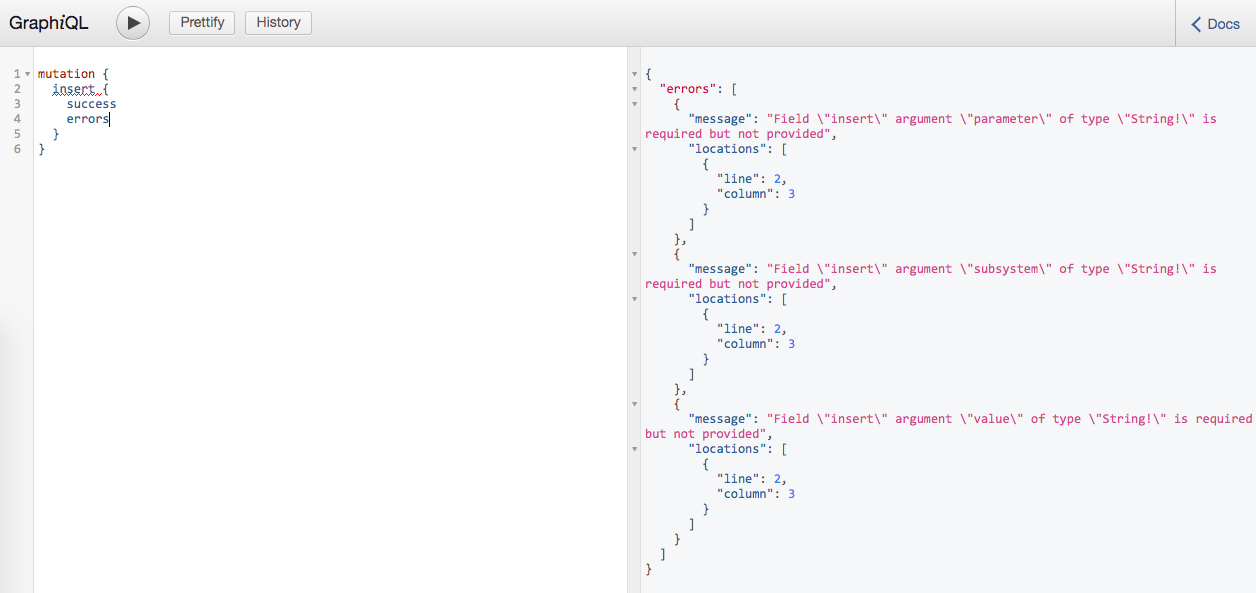

I’d completely overlooked the Docs panel the entire time 🤦♂️. Three of the arguments to insert had types that ended with an exclamation mark. The previously mentioned cheatsheet had a section about built-in types and listed String as a nullable string and String! as a required string, which told me that parameter, subsystem, and value were required arguments for insert. From the data I pulled into pandas earlier, I concluded these arguments should be "VIDIODE", "eps", and a stringified number—I set it to "12" because that was close to double the existing VIDIODE value. Various examples on the cheatsheet provided arguments to queries in parentheses, so I did the same and ran the query. Shortly after, the console log displayed a slightly different message:

critical-tel-check  info: Detected new telemetry values.
critical-tel-check  info: Checking recently inserted telemetry values.
critical-tel-check  info: Checking gps subsystem
critical-tel-check  info: gps subsystem: OK
critical-tel-check  info: reaction_wheel telemetry check.
critical-tel-check  info: reaction_wheel subsystem: OK.
critical-tel-check  info: eps telemetry check.
critical-tel-check  warn: VIDIODE battery voltage too high.
critical-tel-check  warn: Solar panel voltage low
critical-tel-check  warn: System CRITICAL.
critical-tel-check  info: Position: GROUNDPOINT
critical-tel-check  warn: Debug telemetry database running at: 3.19.61.44:6079/tel/graphiql
Twelve was too large and the solar panel warning remained unchanged. After some tinkering, I set value to 7 and the system was tricked into thinking it was fine! However, I got a link to the scheduler service (another GraphiQL interface) instead of a printed flag.
critical-tel-check  info: Detected new telemetry values.
critical-tel-check  info: Checking recently inserted telemetry values.
critical-tel-check  info: Checking gps subsystem
critical-tel-check  info: gps subsystem: OK
critical-tel-check  info: reaction_wheel telemetry check.
critical-tel-check  info: reaction_wheel subsystem: OK.
critical-tel-check  info: eps telemetry check.
critical-tel-check  warn: Solar panel voltage low
critical-tel-check  info: eps subsystem: OK
critical-tel-check  info: Position: GROUNDPOINT
critical-tel-check  warn: System: OK. Resuming normal operations.
critical-tel-check  info: Scheduler service comms started successfully at: 3.19.61.44:14207/sch/graphiql
This time I smartly looked at the available queries in the scheduler interface’s documentation and used the autocomplete to fill in all possible fields.
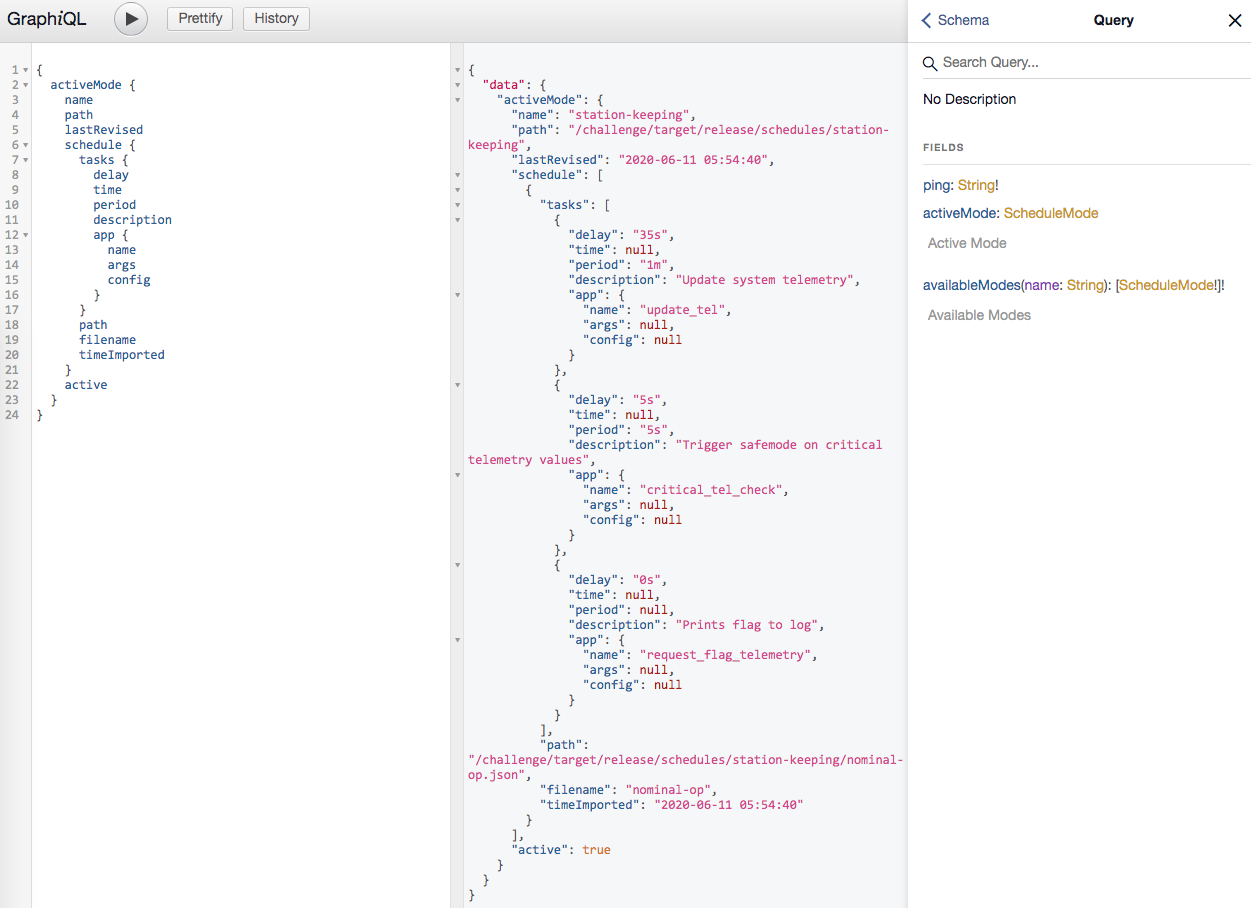
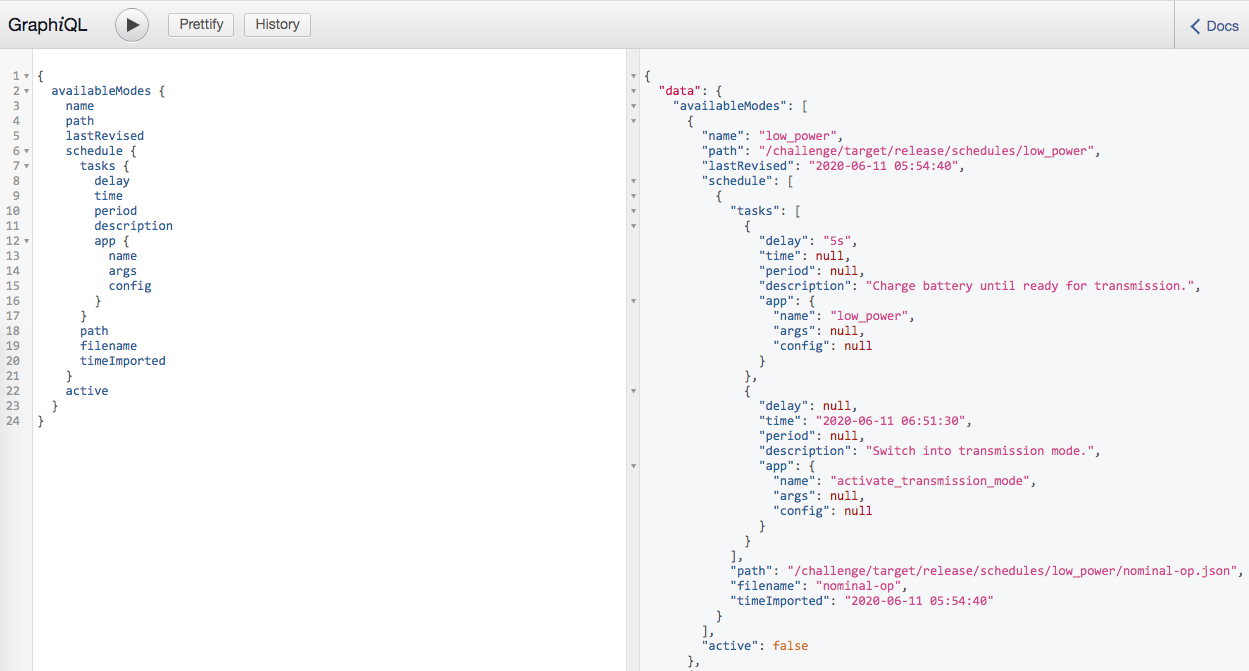
Full availableModes response (click to expand)
# availableModes response
{
  "data": {
    "availableModes": [
      {
        "name": "low_power",
        "path": "/challenge/target/release/schedules/low_power",
        "lastRevised": "2020-06-11 05:54:40",
        "schedule": [
          {
            "tasks": [
              {
                "delay": "5s",
                "time": null,
                "period": null,
                "description": "Charge battery until ready for transmission.",
                "app": {
                  "name": "low_power",
                  "args": null,
                  "config": null
                }
              },
              {
                "delay": null,
                "time": "2020-06-11 06:51:30",
                "period": null,
                "description": "Switch into transmission mode.",
                "app": {
                  "name": "activate_transmission_mode",
                  "args": null,
                  "config": null
                }
              }
            ],
            "path": "/challenge/target/release/schedules/low_power/nominal-op.json",
            "filename": "nominal-op",
            "timeImported": "2020-06-11 05:54:40"
          }
        ],
        "active": false
      },
      {
        "name": "safe",
        "path": "/challenge/target/release/schedules/safe",
        "lastRevised": "1970-01-01 00:00:00",
        "schedule": [],
        "active": false
      },
      {
        "name": "station-keeping",
        "path": "/challenge/target/release/schedules/station-keeping",
        "lastRevised": "2020-06-11 05:54:40",
        "schedule": [
          {
            "tasks": [
              {
                "delay": "35s",
                "time": null,
                "period": "1m",
                "description": "Update system telemetry",
                "app": {
                  "name": "update_tel",
                  "args": null,
                  "config": null
                }
              },
              {
                "delay": "5s",
                "time": null,
                "period": "5s",
                "description": "Trigger safemode on critical telemetry values",
                "app": {
                  "name": "critical_tel_check",
                  "args": null,
                  "config": null
                }
              },
              {
                "delay": "0s",
                "time": null,
                "period": null,
                "description": "Prints flag to log",
                "app": {
                  "name": "request_flag_telemetry",
                  "args": null,
                  "config": null
                }
              }
            ],
            "path": "/challenge/target/release/schedules/station-keeping/nominal-op.json",
            "filename": "nominal-op",
            "timeImported": "2020-06-11 05:54:40"
          }
        ],
        "active": true
      },
      {
        "name": "transmission",
        "path": "/challenge/target/release/schedules/transmission",
        "lastRevised": "2020-06-11 05:54:40",
        "schedule": [
          {
            "tasks": [
              {
                "delay": null,
                "time": "2020-06-11 06:51:40",
                "period": null,
                "description": "Orient antenna to ground.",
                "app": {
                  "name": "groundpoint",
                  "args": null,
                  "config": null
                }
              },
              {
                "delay": null,
                "time": "2020-06-11 06:52:00",
                "period": null,
                "description": "Power-up downlink antenna.",
                "app": {
                  "name": "enable_downlink",
                  "args": null,
                  "config": null
                }
              },
              {
                "delay": null,
                "time": "2020-06-11 06:52:05",
                "period": null,
                "description": "Power-down downlink antenna.",
                "app": {
                  "name": "disable_downlink",
                  "args": null,
                  "config": null
                }
              },
              {
                "delay": null,
                "time": "2020-06-11 06:52:10",
                "period": null,
                "description": "Orient solar panels at sun.",
                "app": {
                  "name": "sunpoint",
                  "args": null,
                  "config": null
                }
              }
            ],
            "path": "/challenge/target/release/schedules/transmission/nominal-op.json",
            "filename": "nominal-op",
            "timeImported": "2020-06-11 05:54:40"
          }
        ],
        "active": false
      }
    ]
  }
}
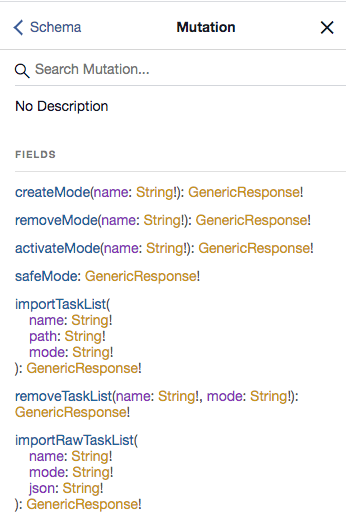
Every minute, the virtual console updated telemetry values, overwriting my fake value, and the system entered a critical state again. The scheduler interface closed (my queries wouldn’t run there) until I set VIDIODE to 7 again in the telemetry interface. This back-and-forth was annoying to deal with while I tried to explore the scheduler interface. I also took a screenshot of the available scheduler mutation queries for reference before the challenge connection timed out.
update_tel  info: Updating reaction_wheel telemetry.
update_tel  info: Updating gps telemetry.
update_tel  info: Updating eps telemetry.

critical-tel-check  info: Detected new telemetry values.
critical-tel-check  info: Checking recently inserted telemetry values.
critical-tel-check  info: Checking gps subsystem
critical-tel-check  info: gps subsystem: OK
critical-tel-check  info: reaction_wheel telemetry check.
critical-tel-check  info: reaction_wheel subsystem: OK.
critical-tel-check  info: eps telemetry check.
critical-tel-check  warn: VIDIODE battery voltage too low.
critical-tel-check  warn: Solar panel voltage low
critical-tel-check  warn: System CRITICAL.
critical-tel-check  info: Position: GROUNDPOINT
critical-tel-check  warn: Stopping non-essential services.
critical-tel-check  warn: Debug telemetry database running at: 3.19.61.44:14207/tel/graphiql
critical-tel-check  info: Closing scheduler service.
I examined the availableModes response next:
- Each mode had a schedule that was comprised of a list of tasks. Each task ran either at a set
time(designated by a timestamp) or at a certain time offset (delay) after the mode was activated.- Some tasks had a
periodkey; these indicated periodicity of tasks that occurred at regular intervals. Tasks that had aperiodkey always had adelaykey present. Tasks that occurred at a specifictimelackedperiodkeys since they were one-time tasks, which didn’t repeat. - Each task also had a pertinent
descriptionandappstring. I assumed theappkey held the name of the program or executable to be run. I referred to each task by its app name.
- Some tasks had a
- Station-keeping mode was the only active mode. It had the annoying
update_telfor updating telemetry values every minute, acritical_tel_checkfor activating safe mode, and arequest_flag_telemetrytask that would print the flag to the log when station-keeping was activated! My goal was to run the flag task, and I planned to do so by activating thestation-keepingmode again sincerequest_flag_telemetryonly ran once when the mode was activated (itsdelaywas zero seconds). - Safe mode was inactive and seemed to be responsible for shutting down the scheduler service each time the fake
VIDIODEvalue was overwritten. - Low-power mode would have the system go into low power to charge the battery, then wake up at a specified timestamp to switch into transmission mode. I recalled the challenge prompt for SpaceDB said “Note: When you’re done planning, go to low power mode to wait for the next transmission window.”
- Transmission mode had a series of one-time tasks starting 10 seconds after low-power mode activated transmission mode. It would point the antenna at the ground, power it up 20 seconds later, power it down after five seconds, then point solar panels at the sun after five more seconds. I noticed that the console logs repeatedly printed
info: Position: GROUNDPOINT, which is likely what thegroundpointtask here did. - All schedules except
safeseemed to be imported from anominal-opfile. I looked up the definition of “nominal” and read it defined as “informal (chiefly in the context of space travel) functioning normally or acceptably.”
I first pursued the theory that reactivating station-keeping mode in a noncritical state could print the flag to the console log. To do this, I connected to the challenge, set VIDIODE to 7 in the telemetry interface, then ran the activateMode(name:"station-keeping") mutation query in the scheduler interface. Instead of printing the flag, both GraphiQL interfaces dropped connection and the virtual console displayed this before halting:
WARN: Could not establish downlink.
ERROR: Downlink: FAILED
WARN: LOW battery.
Shutting down...
Goodbye.
I repeated the same steps several times, yet the result didn’t change. The virtual console failed to display messages about telemetry values, which led me to believe that in a noncritical state, the system was unable to execute the update_tel and critical_tel_check tasks. Instead, something went wrong in the request_flag_telemetry task, which attempted to “downlink” before printing the flag. The system shut down due to a critical battery status even though I had faked the VIDIODE value and the console lacked messages about any telemetry updates. I googled “downlink” and found it described a data communication going from the satellite down to the ground. I recalled the transmission mode had downlink-related tasks (enable_downlink and disable_downlink) and was set up to orient the satellite towards the ground before a downlink.
It seemed reasonable to check out the behavior of transmission mode, so I reconnected, faked VIDIODE to open the scheduler, and ran the activateMode(name:"transmission") mutation query. This time, absolutely nothing happened and the console remained blank until the challenge timed out. I was baffled and thought there was a problem with my connection, so I repeated the process a few more times, yet no messages appeared in the console until my challenge connection timed out. Once again, I performed the same steps until right before transmission mode activation, when I instead queried for all available modes to check if I was missing any parameters. I noticed that all of the response’s timestamps were in UTC format. After further inspection, I later realized that all the transmission tasks were one-time tasks scheduled to run about an hour into the future. Since the virtual system and schedules were dynamically created and ran in real-time, my challenge connection was guaranteed to time out before I’d get a chance to see the output of transmission mode.
This only added to my confusion. The next logical step was to reconnect and activate the remaining low_power mode:
Low_power mode enabled.
Timetraveling.

Transmission mode enabled.

WARN: Battery critical.
INFO: Shutting down.
Goodbye
The “timetraveling” message was interesting! I inferred it meant the virtual system’s clock was sped up to the timestamp listed for the activate_transmission_mode task. With the clock set to a future time, the scheduler could execute activate_transmission_mode, but again the battery was in a critical state so the transmission mode led to a system shut down. Looking at the low-power mode’s tasks, I noticed that low_power was responsible for putting the system to sleep while the battery charged and waking up the system at a later time. This was likely why the challenge prompt noted “When you’re done planning, go to low power mode to wait for the next transmission window”—executing low_power was necessary for time travel.
Transmission mode would orient the satellite towards the ground for the downlink and later towards the sun once the downlink antenna was powered down, likely to resume low-power mode and battery charging. Earlier when I was working with the telemetry interface, I saw info: Position: GROUNDPOINT regularly printed in the console, but the logs didn’t show any indication of the satellite’s orientation changing after activating low-power mode. I figured this was the bug mentioned in the challenge prompt that caused the battery to drain.
My new plan was to orient the satellite towards the sun before going into low-power mode to ensure the battery would correctly charge. If the battery was stable after charging, the transmission tasks would hopefully complete the downlink operations. But that wasn’t all; my overarching objective was to obtain the flag, which would likely only be printed if the request_flag_telemetry task ran. I definitely needed to activate low-power mode to get the time travel to happen, and could only activate one mode before the system shut down, so any tasks I wanted to run with a charged battery needed to be added to the transmission schedule. Since it attempted to downlink, I decided the best placement for request_flag_telemetry was between enable_downlink and disable_downlink in the transmission schedule. As for orienting towards the sun, I needed the sunpoint task to run before the low_power task executed.
According to the Docs panel, there wasn’t a way for me to add a single task to a schedule; the system only had mutation query functions for importing an entire list of tasks into a schedule. It looked like all the existing schedules had been imported using the importTaskList mutation query that added tasks from a JSON file. I didn’t have access to the filesystem of the interface, but I did notice a similar importRawTaskList mutation query which would let me pass in a custom task list as JSON string instead of a file.
First, I needed to replace low-power mode’s task list with a modified version that ran sunpoint immediately when low-power mode was activated. To do this, I queried for low-power mode’s task list, copied the response into a text editor, added a sunpoint task object to be run immediately ("delay": "0s") in the copy, converted the whole thing into a JSON string using this online tool, and ran the importRawTaskList mutation query with the string as json.
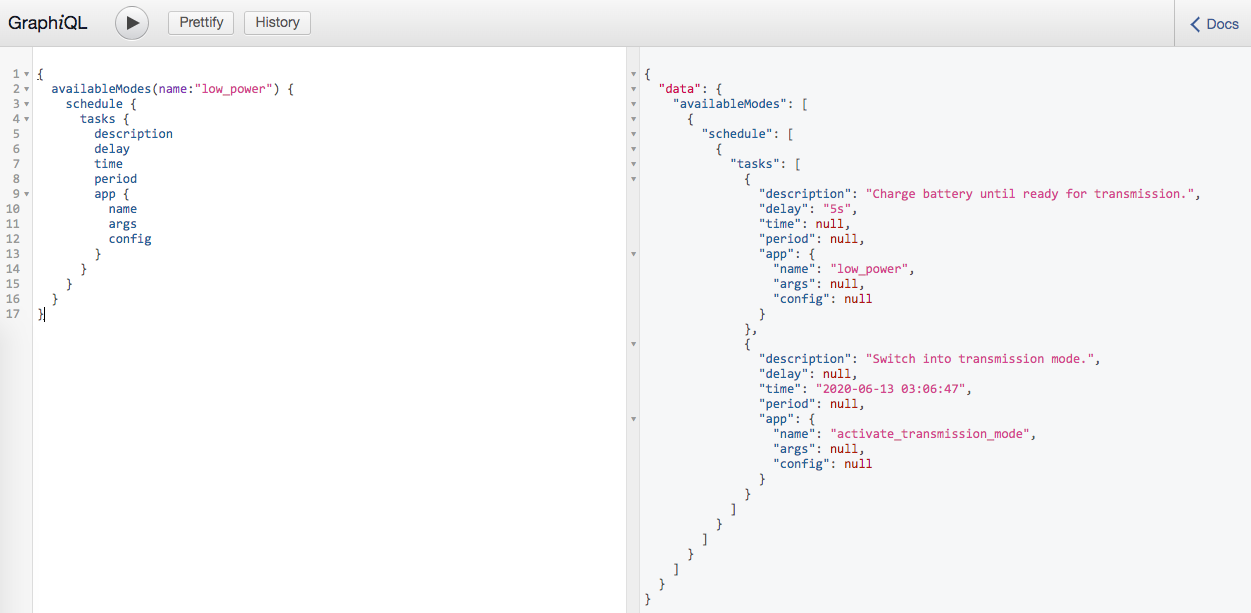

Full JSON (click to expand)
# Modified task list
{
  "tasks": [
    {
      "description": "Sunpoint",
      "delay": "0s",
      "app": {
        "name": "sunpoint"
      }
    },
    {
      "description": "Charge battery until ready for transmission.",
      "delay": "5s",
      "app": {
        "name": "low_power"
      }
    },
    {
      "description": "Switch into transmission mode.",
      "time": "2020-06-13 03:06:47",
      "app": {
        "name": "activate_transmission_mode"
      }
    }
  ]
}

# importRawTaskList mutation query
mutation {
  importRawTaskList(
    name:"nominal-op"
    mode:"low_power"
    json:"{\n  \"tasks\": [\n    {\n      \"description\": \"Sunpoint\",\n      \"delay\": \"0s\",\n      \"app\": {\n        \"name\": \"sunpoint\"\n      }\n    },\n    {\n      \"description\": \"Charge battery until ready for transmission.\",\n      \"delay\": \"5s\",\n      \"app\": {\n        \"name\": \"low_power\"\n      }\n    },\n    {\n      \"description\": \"Switch into transmission mode.\",\n      \"time\": \"2020-06-13 03:06:47\",\n      \"app\": {\n        \"name\": \"activate_transmission_mode\"\n      }\n    }\n  ]\n}"
  ) {
    success
    errors
  }
}
Next, I followed similar steps to get transmission mode’s existing task list, set request_flag_telemetry to run in between enable_downlink and disable_downlink in my local copy (I set it to run one second after enable_downlink), JSON stringified it, and imported the raw task list into transmission mode’s schedule.
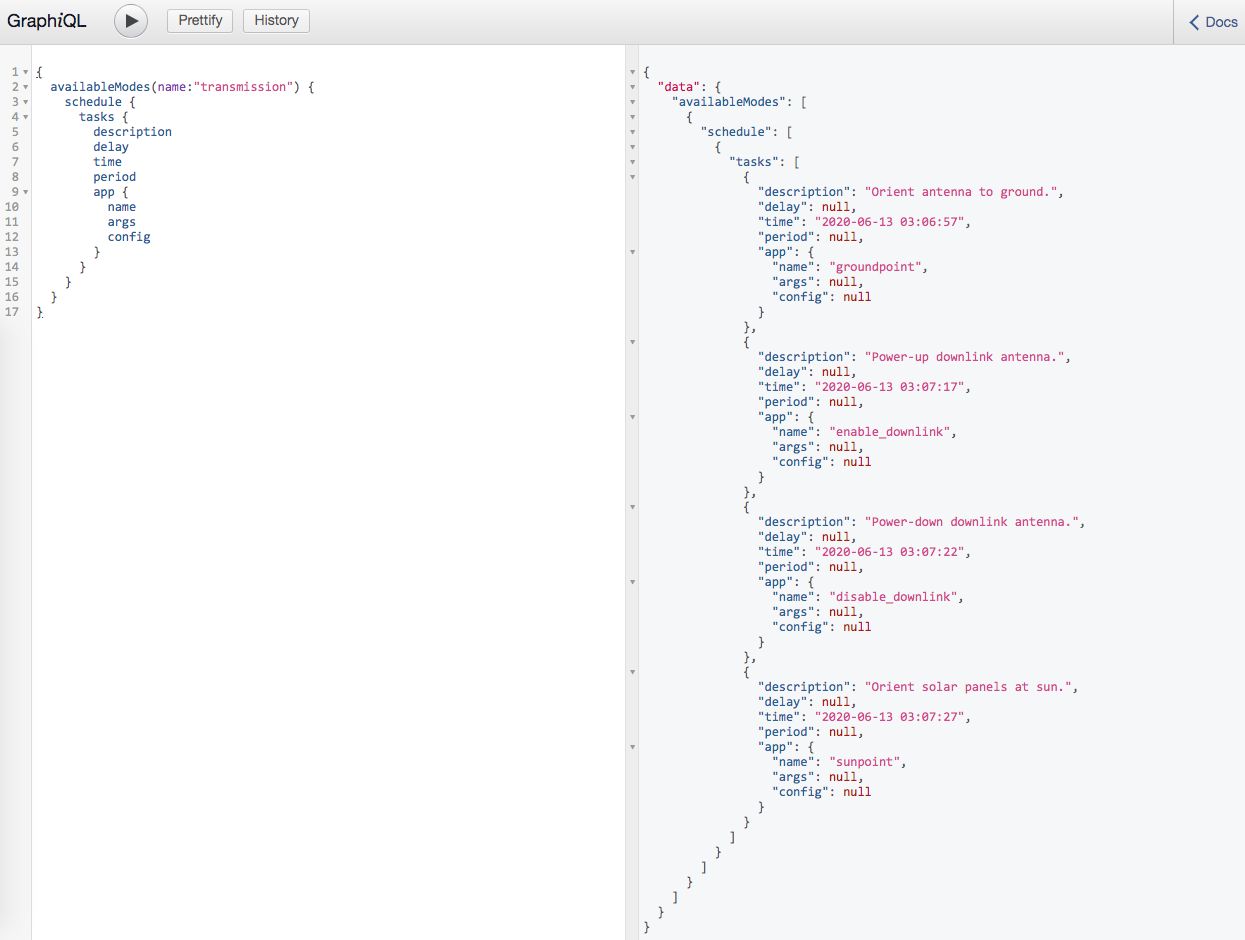

Full JSON (click to expand)
# Modified task list
{
  "tasks": [
    {
      "description": "Orient antenna to ground.",
      "delay": null,
      "time": "2020-06-13 03:06:57",
      "period": null,
      "app": {
        "name": "groundpoint",
        "args": null,
        "config": null
      }
    },
    {
      "description": "Power-up downlink antenna.",
      "delay": null,
      "time": "2020-06-13 03:07:17",
      "period": null,
      "app": {
        "name": "enable_downlink",
        "args": null,
        "config": null
      }
    },
    {
      "description": "get flag",
      "delay": null,
      "time": "2020-06-13 03:07:18",
      "period": null,
      "app": {
        "name": "request_flag_telemetry",
        "args": null,
        "config": null
      }
    },
    {
      "description": "Power-down downlink antenna.",
      "delay": null,
      "time": "2020-06-13 03:07:22",
      "period": null,
      "app": {
        "name": "disable_downlink",
        "args": null,
        "config": null
      }
    },
    {
      "description": "Orient solar panels at sun.",
      "delay": null,
      "time": "2020-06-13 03:07:27",
      "period": null,
      "app": {
        "name": "sunpoint",
        "args": null,
        "config": null
      }
    }
  ]
}

# importRawTaskList mutation query
mutation {
  importRawTaskList(
    name:"nominal-op"
    mode:"transmission"
    json:"{\n  \"tasks\": [\n    {\n      \"description\": \"Orient antenna to ground.\",\n      \"delay\": null,\n      \"time\": \"2020-06-13 03:06:57\",\n      \"period\": null,\n      \"app\": {\n        \"name\": \"groundpoint\",\n        \"args\": null,\n        \"config\": null\n      }\n    },\n    {\n      \"description\": \"Power-up downlink antenna.\",\n      \"delay\": null,\n      \"time\": \"2020-06-13 03:07:17\",\n      \"period\": null,\n      \"app\": {\n        \"name\": \"enable_downlink\",\n        \"args\": null,\n        \"config\": null\n      }\n    },\n    {\n      \"description\": \"get flag\",\n      \"delay\": null,\n      \"time\": \"2020-06-13 03:07:18\",\n      \"period\": null,\n      \"app\": {\n        \"name\": \"request_flag_telemetry\",\n        \"args\": null,\n        \"config\": null\n      }\n    },\n    {\n      \"description\": \"Power-down downlink antenna.\",\n      \"delay\": null,\n      \"time\": \"2020-06-13 03:07:22\",\n      \"period\": null,\n      \"app\": {\n        \"name\": \"disable_downlink\",\n        \"args\": null,\n        \"config\": null\n      }\n    },\n    {\n      \"description\": \"Orient solar panels at sun.\",\n      \"delay\": null,\n      \"time\": \"2020-06-13 03:07:27\",\n      \"period\": null,\n      \"app\": {\n        \"name\": \"sunpoint\",\n        \"args\": null,\n        \"config\": null\n      }\n    }\n  ]\n}"
  ) {
    success
    errors
  }
}
To put everything together, I activated low-power mode and anxiously watched the virtual console:
Low_power mode enabled.
Timetraveling.

sunpoint  info: Adjusting to sunpoint...
sunpoint  info: [2020-06-13 02:13:03] Sunpoint panels: SUCCESS

Transmission mode enabled.

Pointing to ground.
Transmitting...

----- Downlinking -----
Recieved flag.
flag{<REDACTED>}

Downlink disabled.
Adjusting to sunpoint...
Sunpoint: TRUE
Goodbye
With under an hour left in the competition, I finally had the flag! 😎
Note: Although some failed attempts were recounted in this writeup for SpaceDB, there were plenty more tales of failure and frustration that were omitted. These included trials in creating new modes, adjusting numerous timestamps and delay values, reordering tasks, deleting schedules, typos that led to system shutdowns, debugging malformed queries, frenzied googling, reading articles about satellite housekeeping and telemetry, scouring dated StackOverflow posts and obscure forums about kubOS for solace (it’s a real thing with its own documentation!), and much more. Props to the architect(s) for creating such an intricate challenge. 👏